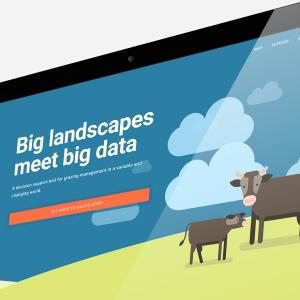
Calculate stocking rates for cattle, horses, and sheep on any landscape in the Western U.S. with this decision support tool.

Remote Sensed Data
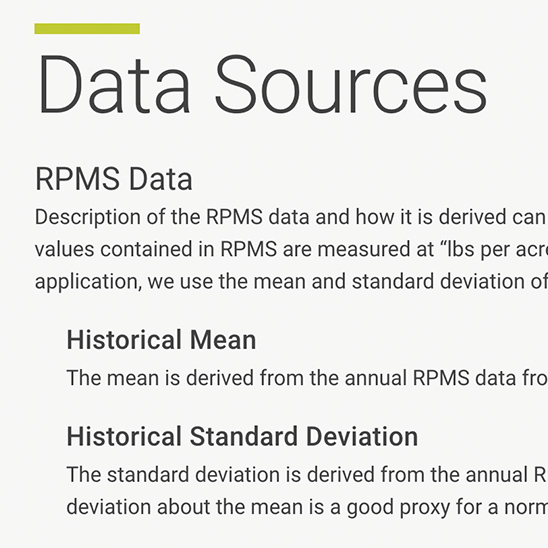
Leverages the Rangeland Production Monitoring Service, based on remote-sensed Normalized Difference Vegetation Index data, to calculate vegetation production over time and across the landscape.
Visualize Operations
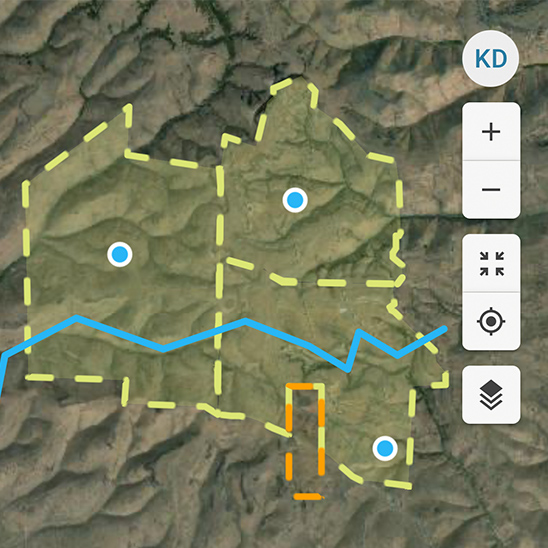
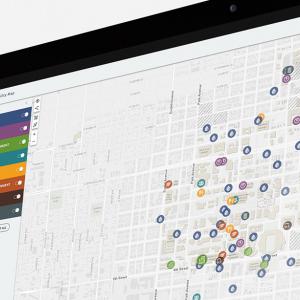
Get the big picture. See on a map how factors such as distance to water, slope, tree cover, and more affect how one would stock animals in multiple operations.
Import or Draw Shapes
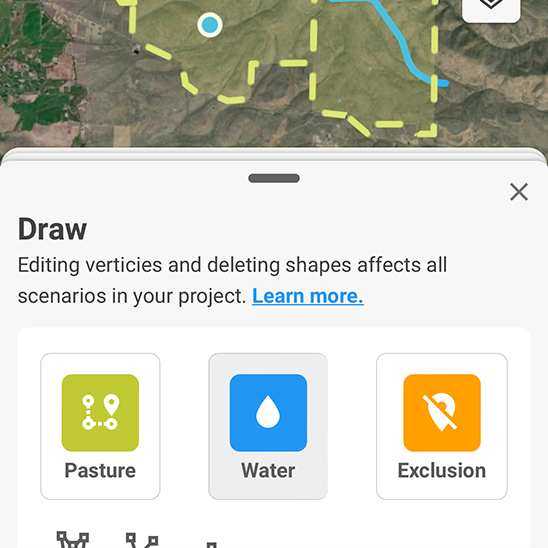
On the map, import shape files or draw pastures, water locations such as streams, lakes, and tanks. Then exclude places livestock can't or won't use.
Calculate Stocking Rate
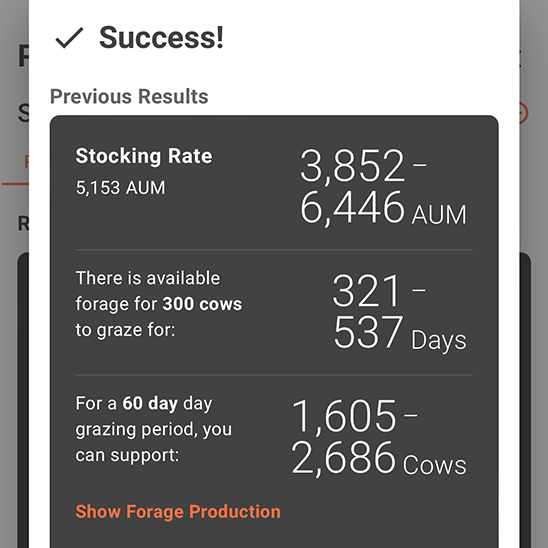
In seconds, calculate possible stocking rates and explore how changes to an infrastructure or other operational characteristics could affect the stocking rate of animals.
Compare Scenarios
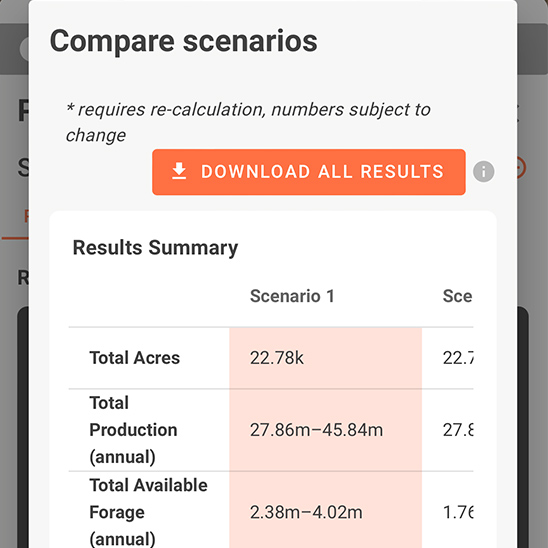
Explore management actions you are considering on grazed rangelands, like installing new water locations or changing herd characteristics, using saved scenarios. Compare multiple scenarios to reveal how these decisions may affect stocking rates. Download, print, and share reports.
Collaboration
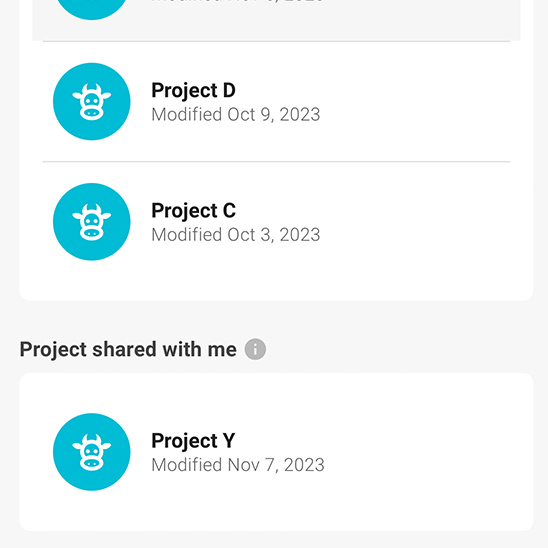
Sharing a project is the best way to show scenarios and stocking rate results to someone else. An account holder can grant another person read-only access or allow them to edit their project as a contributor.
User Account
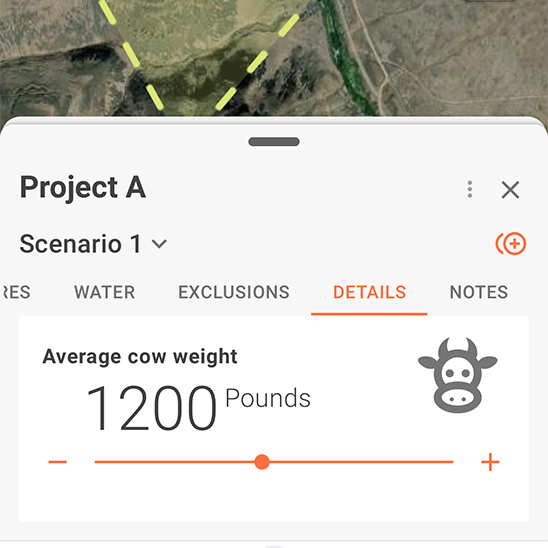
Anyone can use the basic features of StockSmart, but creating an account unlocks features such as saving your work, inviting others to projects, duplicating scenarios, side-by-side comparisons, and uploading/storing data files to omit the need to draw shapes.
How-to Guide
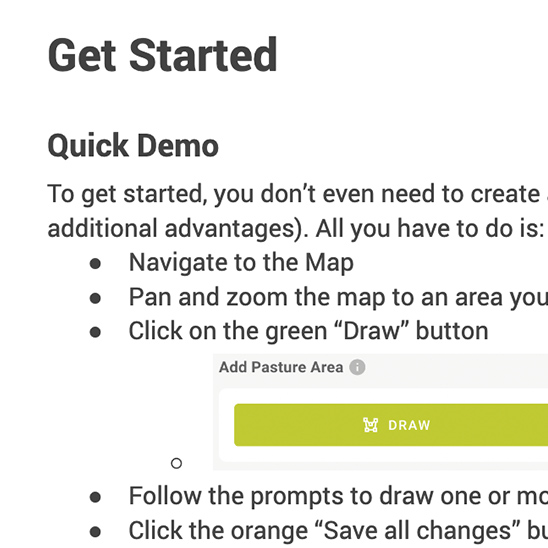
Documentation on how-to-use includes step-by-step instructions with animated gifs to visually guide the user. Features of the app are clearly defined and explained in simple language. The private Google Doc is accessible through the marketing site and the app via contextual links that appear in Help tips.
Responsive design:

